 ChecksCoin
How to Read ETF Flow Data Like a Professional
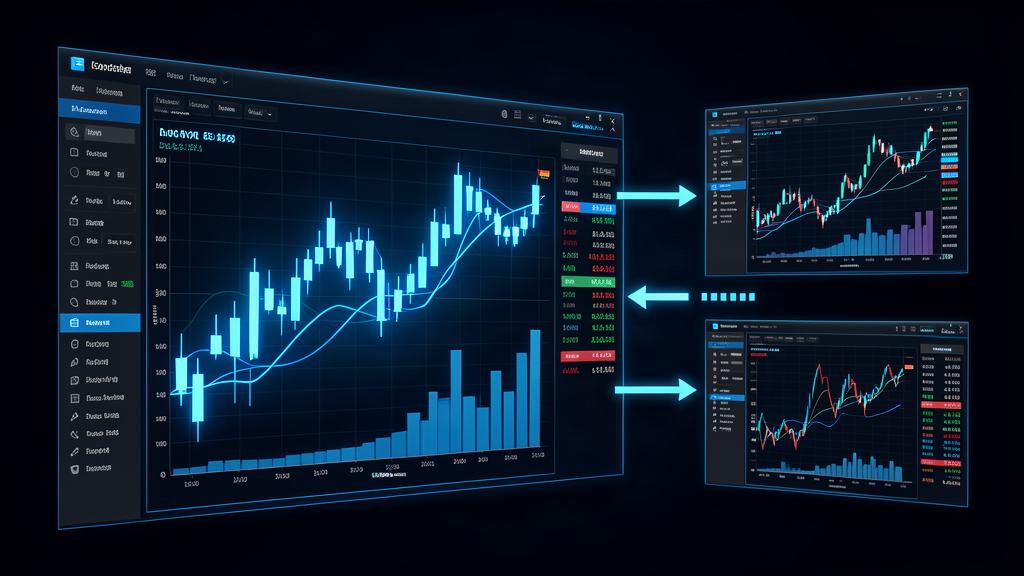
ETF flow data is published daily, consumed instantly, and misunderstood constantly. The number that flashes across your screen — "$200M inflow" or "$150M outflow" — is the least informative part of the report. The professionals who trade on flow data are not reading the headline; they are reading the structure underneath it. Here is how to do the same.
What a flow report actually contains
A typical daily flow report for spot Bitcoin ETFs includes, for each fund: AUM, daily flow, cumulative flow since launch, trading volume, and premium or discount to NAV. The headline number is the sum of daily flows across all funds. Each of these fields tells a different story, and conflating them is the most common error.
AUM is a stock, not a flow. It reflects the current value of assets held, which moves with both investor activity and price. A rising AUM during a price decline means net inflows; a falling AUM during a price rise means net outflows. Always check whether AUM changes are driven by price or by flow.
Daily flow is the net creation or redemption for that day, in dollars. It is the headline number and the most noisy.
Cumulative flow is the running total since launch. It smooths out daily noise and shows the underlying trend in investor positioning.
Volume is the total shares traded. It indicates liquidity and interest but does not distinguish buying from selling.
Premium/discount to NAV shows whether the ETF is trading above or below the value of its underlying holdings. This is a real-time indicator of demand pressure that often leads flow data.
The decomposition framework
When you see a flow number, run it through this framework before forming an opinion:
Step 1: Check concentration
Look at the per-fund breakdown. Is the flow concentrated in one or two funds, or spread across many? Concentrated flow usually reflects a single large allocator's decision, which may be idiosyncratic. Dispersed flow reflects broad sentiment and is more informative about the asset class.
Step 2: Check the premium/discount
If the ETF is trading at a premium to NAV, inflows are likely driven by genuine demand exceeding supply. If it is at a discount, outflows may be driven by arbitrage rather than sentiment. The premium/discount often moves before the flow number, making it a leading indicator.
Step 3: Check volume
High volume with modest net flow means active two-sided trading: buyers and sellers are both present, and the market is liquid. Low volume with large flow means a few big transactions moved the number, which is less representative of broad sentiment.
Step 4: Check the macro context
Ask what else happened that day. A Fed decision, an inflation print, an equity market move — any of these can drive ETF flows that have nothing to do with crypto-specific sentiment. If the flow moved in line with broader risk assets, it is probably a macro signal, not a crypto signal.
Step 5: Check persistence
One day is noise. A week is a hint. A month is a trend. Do not overreact to single-day prints. Track the rolling 5-day and 20-day flow to identify genuine shifts in positioning.
Common traps
Even experienced analysts fall into these traps:
- Confusing flow with conviction. A large inflow does not mean investors are bullish; it may reflect a single institutional mandate change, a rebalancing, or a tax-driven transaction.
- Ignoring price effects on AUM. A fund's AUM can grow because its holdings appreciated, not because investors added money. Always check flow separately from AUM.
- Overweighting the largest fund. The largest fund by AUM will often have the largest absolute flow, but this reflects its size, not its importance. Look at flow as a percentage of AUM for a fairer comparison.
- Reacting to intraday estimates. Intraday flow estimates are often revised significantly by end of day. Wait for the final, confirmed number before drawing conclusions.
- Ignoring the options market. Options activity on ETFs often leads flow data, as institutions use options to position before committing capital. Check options volume and open interest for early signals.
Building a flow dashboard
If you want to track ETF flows seriously, build a simple dashboard with these components:
- Daily flow by fund, with a 5-day rolling average.
- Cumulative flow since launch, charted over time.
- Premium/discount to NAV, intraday and end-of-day.
- Flow as a percentage of AUM, to normalize for fund size.
- Rolling 20-day flow, to identify trends.
- Correlation with Bitcoin price, to distinguish crypto-specific from macro-driven flow.
This dashboard takes an hour to build and will immediately put you ahead of the majority of market participants who are still reading headlines.
The meta-lesson
ETF flow data is a tool, not an oracle. It tells you what happened, not what will happen. It is most useful as a confirming indicator — it validates or contradicts a thesis you have already formed through other analysis — rather than as a standalone signal.
The best use of flow data is to understand the positioning of other market participants. If everyone is already long, the marginal buyer is exhausted, and the risk-reward of adding exposure deteriorates. If positioning is light, there is room for a move. Flow data, read properly, tells you where positioning stands. That is its real value, and it is worth the effort to read it right.